2. Given 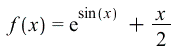 limited to the interval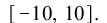
| > |  |
| > |  |
| > | 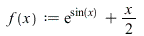 |
![Typesetting:-mprintslash([f := proc (x) options operator, arrow, function_assign; `+`(exp(sin(x)), `*`(`/`(1, 2), `*`(x))) end proc], [proc (x) options operator, arrow, function_assign; `+`(exp(sin(x)...](images/Maple 19 SVDiff Calc Workbook Solutions_866.gif) |
(7.2.1) |
| > | ![with(Student[Calculus1]); -1](images/Maple 19 SVDiff Calc Workbook Solutions_867.gif) |
| > |  |
 |
| > |  |
| > |  |
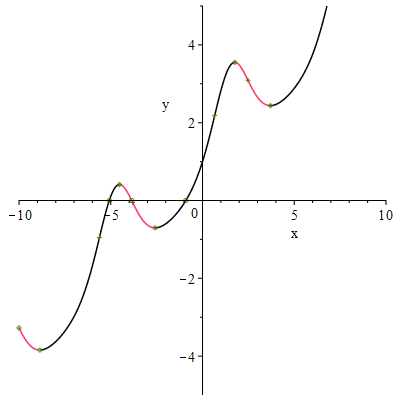 |
| > |  |
| > |  |
| > |  |
| > |  |
 |
(7.2.2) |
| > |  |
 |
(7.2.3) |
| > |  |
 |
(7.2.4) |
| > |  |
 |
(7.2.5) |
| > |  |
| > | ![inequal([`>`(fp(x), 0), `>`(fpp(x), 0)], x = -10 .. 10, y = -5 .. 5);](images/Maple 19 SVDiff Calc Workbook Solutions_885.gif) |
 |
| > |  |
| > |
2. Given limited to the interval
| > | |
| > | |
| > | |
|
(7.2.1) |
| > | |
| > | |
|
| > | |
| > | |
|
| > | |
| > | |
| > | |
| > | |
|
(7.2.2) |
| > | |
|
(7.2.3) |
| > | |
|
(7.2.4) |
| > | |
|
(7.2.5) |
| > | |
| > | |
|
| > | |
| > |